SAE interactive data
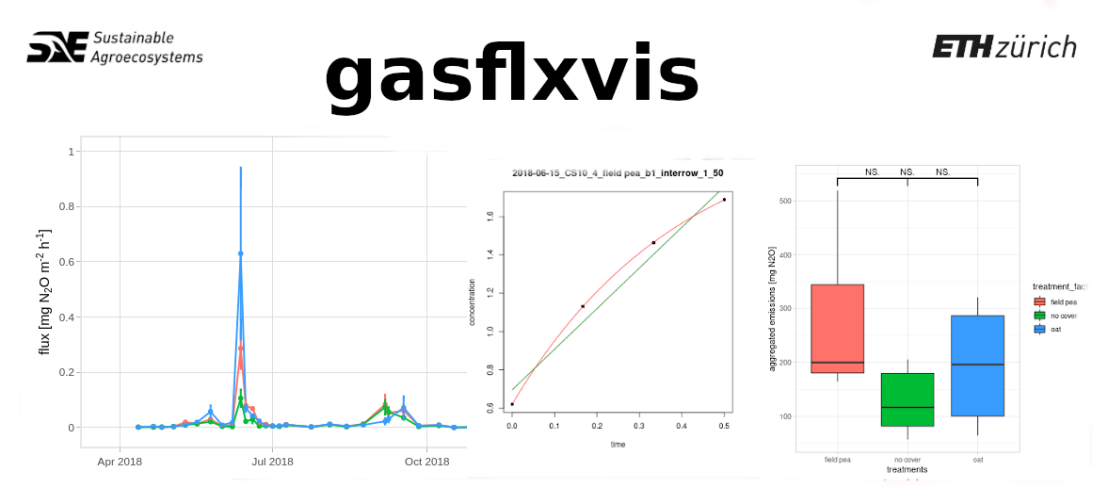
Soil Greenhouse Gas Flux Visualisation for DiverFarming
The “gasflxvis” shiny app has been developed for the European H2020 project DiverFarming (www.diverfarming.eu) in order to visualise field GHG data for the project partners that send their field GHG samples to our lab in Zurich. However, the app now offers flux calculation and visualisation for anyone to be done online. The greenhouse gas flux calculation options for linear, non-linear and combined approach to make the best use of your rawdata.
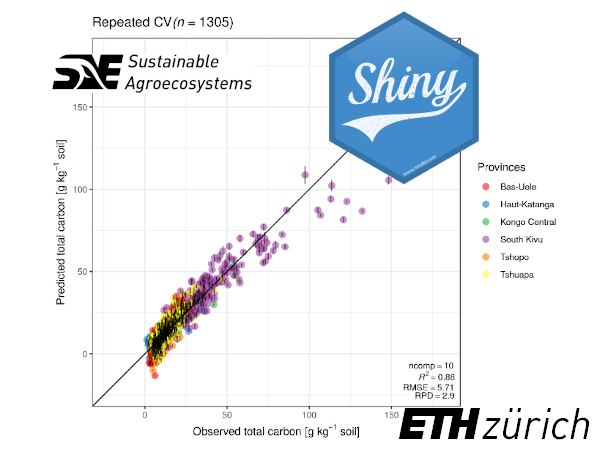
A Spectral Platform for Soil Characterization in the Congo Basin
The Congo Basin, which encompasses the second largest tropical forest ecosystem on Earth, faces rapid land use change due to population growth and agricultural expansion. Information on soil properties is crucial to improve and preserve ecosystem services, such as food security and carbon storage. Here, we created a soil spectral library for the Democratic Republic of Congo (DRC) to facilitate inexpensive soil analysis without major investments in wet chemistry. In addition, we created an R-based application to upload and graphically analyze soil spectra. Ultimately, the application can predict soil properties with established calibration models. Currently, our library contains more than 1300 individual soil samples from sites located throughout the Congo Basin, including swamp forests, natural lowland forests, highland montane forests, termite mounds, and agricultural fields.
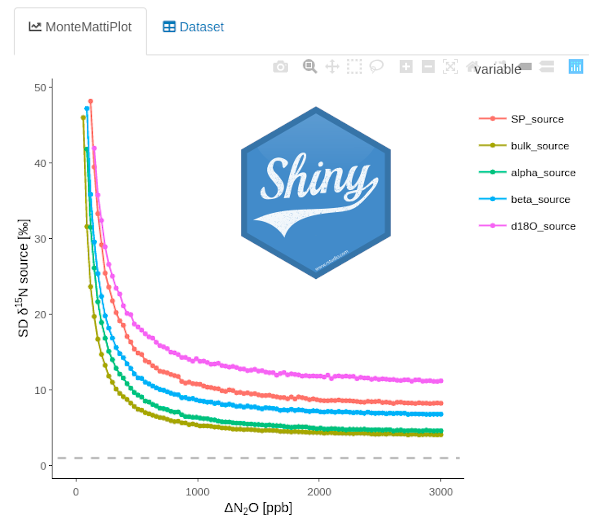
Keeling plot simulation for nitrous oxide laser spectroscopy
This app simulates the uncertainty of the source signature from for a two concentration timepoint mixing model. Nitrous oxide isotopocule measurements can be evaluated for the reliability to be used for source signature estimation. It was designed to help find the minimal increase in the different isotope species in order to have a reliable soil source signature estimate.
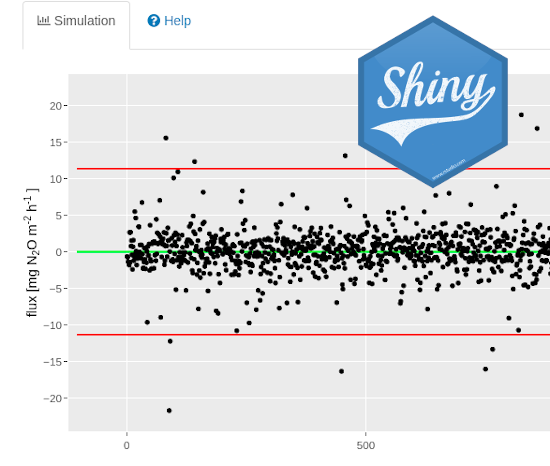
Minimal detectable flux calculation for static chamber GHG measurements
This app calculates the detection limit of static chamber-based soil greenhouse gas flux measurements. There are two “minimal detectable flux” (MDF) estimates that have different purposes:
non-linear: Allowing zero-fluxes to be estimated by the non-linear HMR regression will lead to high uncertainties and hence a high MDF. This value should be used to restrict the MDL for the dynamic kappa.max selection method in the gasfluxes package (see methods)
robust-linear: Use this option to always apply the robust-linear flux estimate of the gasfluxes function. This lower MDF is useful to describe a GHG measurement system in a publication. It represents a low estimate of the accuracy of your flux measurements.
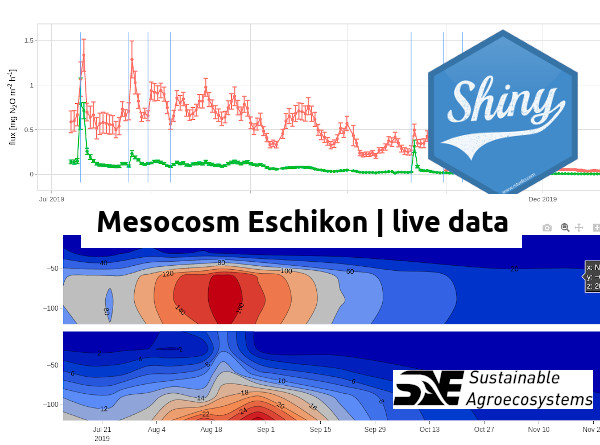
Soil column experiment live data from Eschikon
Data of the Mesocosm Experiment in Eschikon can be checked online with this shiny app. This allows to understand the current state of the experiment and whether the data set is complete or not. The upper panel shows surface emissions measured by the automatic chamber system whereas the lower panel shows the data collected in the soil profile. This tool is currently used for educational purposes.
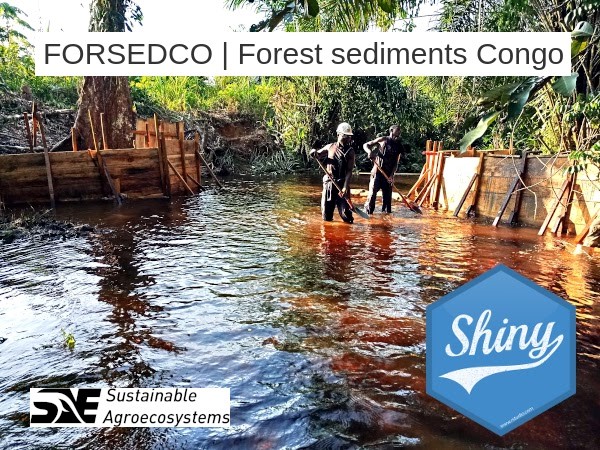
FORSEDCO - Forest sediments in Congo
This app visualize data from a river catchment to look at forest sediments in the Congo.